
How to Evaluate Copy Trading Strategy Managers: A 430-Manager Due Diligence Study
An evidence-first framework for assessing cTrader Copy and XM Copy Trading strategy managers, built on a broad observed sample of 430 managers and about 112,500 closed trades. What the visible statistics do and do not tell you, which behaviours actually predict damage, and what happened when we tested one observable market pattern against real broker execution costs.
This is research and due diligence, not investment advice. Nothing here is a recommendation to copy any strategy manager, to use any platform, or to trade at all. Copy trading carries substantial risk of loss. Past performance does not indicate future results. No strategy manager is identified. The 430 managers are those observed during the study period, not a claim to cover every manager available on either platform: directories change continuously, and every figure below describes this observed sample, under this study’s own definitions, at the time it was observed. See the full disclaimer at the end.
Key takeaways
- 276 of the 419 managers we could score carried at least one critical risk pattern under this study’s definitions: a hazard the headline statistics on the page do not show.
- A high win rate is often a warning sign, not a virtue. The most common hazard in the sample was deferred-loss accumulation: closing winners while holding losers open. It produces a near-perfect closed-trade record and a drawdown figure that only appears in a different field on the same page. One record showed 199 wins in its last 200 closed trades beside a 27.5% reported equity drawdown, which needs a 37.9% gain to recover.
- Post-loss size escalation is the cleanest single tell we found. Across the sample, managers whose position size after a loss exceeded 2x their size after a win carried a worst-loss tail 2x larger and roughly 2x the peak simultaneous exposure of managers who did not escalate. None of the 89 managers sizing above 1.4x after losses survived our screening gates.
- Evidence quality differs structurally between the two platforms. cTrader Copy publishes a complete, reconcilable trade history. XM Copy Trading exposes a moving window of the most recent 200 closed positions. Applying the same bar to both systematically favours the record you can see least of.
- Two independent analyses of the same evidence, deliberately blind to each other, agreed on very little at the top. One manager appeared in both top fives. All three of the blind pipeline’s top-ranked managers were later rejected or downgraded once behaviour was measured rather than outcomes.
- One manager was wrongly written off because a single availability check failed. Separating "we cannot currently see this record" from "this strategy has deteriorated" restored it. That distinction is a general lesson, not a footnote.
- An observable market pattern looked profitable on smoothed vendor price data and was negative at every stop width on real bid/ask data. The strategy did not change. The data did, and it moved the result across the break-even line. That unresolved question now runs as an instrumented demo experiment, not as live capital.
Table of contents
- The question we set out to answer
- Why picking a copy trading strategy manager is genuinely hard
- How to read this study
- Why headline statistics mislead: three worked examples
- Why martingale and recovery sizing are critical risks in copy trading
- How to evaluate copy trading strategy managers before you copy them
- The evidence-quality asymmetry: cTrader Copy and XM Copy Trading
- Scope: what evidence we actually had
- The metrics, defined properly
- Pipeline one: forensic manager analysis
- Pipeline two: an independent blind audit
- Where the two pipelines disagreed
- The availability correction
- The final shortlist, profiled
- The risk features that actually mattered
- From observed behaviour to a testable market hypothesis
- Why an observable edge failed under real bid/ask costs
- The forward-demo probe
- Limitations and assumptions
- Frequently asked questions
1. The question we set out to answer
Copy trading platforms present a ranked list of strategy managers with a handful of attractive numbers next to each: return, win rate, drawdown, number of investors, a risk score. The implicit promise is that these numbers are sufficient to choose.
We wanted to test that promise. Specifically:
Given only the evidence a platform makes visible to a prospective investor, can you reliably distinguish a strategy manager with a durable edge from one whose record merely looks good?
And a second, harder question that follows from it:
If you can identify a recurring pattern in a manager’s observable trade history, does that pattern still make money once real spreads, commissions and slippage are applied?
This paper reports what we found. It is a due diligence study: an independent audit of available evidence, conducted on visible dashboard data and platform-disclosed statistics. It is not an attempt to obtain, replicate or acquire any manager’s proprietary method, and we make no claim to know what any manager’s actual strategy is.
If you want the practical output rather than the research narrative, skip to section 6. If you want the evidence behind it, read sections 4 and 5 first.
2. Why picking a copy trading strategy manager is genuinely hard
Three structural problems make this different from picking a fund.
The record you see is not the record that exists. A platform decides what to display. It may show every trade ever closed, or only the most recent few hundred. It may show realised profit while open losing positions sit outside the calculation. It may report a drawdown computed on account balance, which by construction excludes unrealised losses on positions still open. None of these are deceptions; they are design choices. But they mean the number labelled "drawdown" on two different platforms can measure two different things.
You inherit the shape of the return stream, not its size. When you copy a manager, your positions are scaled to your capital. What transfers is the pattern: the sequence of wins and losses, the holding times, the overlapping exposure, the behaviour after a loss. The manager’s absolute profit in their account currency is almost irrelevant to you. This is why every metric in a serious evaluation should be scale-free.
The metrics that look most reassuring are the easiest to manufacture. A 95% win rate is trivial to produce: never close a loser. A 2% drawdown is trivial to produce: measure drawdown on realised balance and keep the losses unrealised. High profit factor follows automatically from both. A manager doing this is not necessarily dishonest, and plenty of grid and averaging strategies work this way by design, but the resulting statistics describe the strategy’s bookkeeping, not its risk.
The consequence is that naive ranking by displayed metrics does not merely fail to find good managers. It actively selects for the hazardous ones, because hazardous mechanics produce better-looking numbers than honest ones.
3. How to read this study
This study uses a small amount of its own vocabulary. Everything is defined here, once, before it is used. Standard trading terms (win rate, profit factor, drawdown, payoff ratio) are defined with their formulas in section 9.
| Term | What it means in this study |
|---|---|
| Observation snapshot | One reading of a manager’s visible record at a point in time. A manager’s record was read more than once, so its evidence is assembled from several snapshots. |
| Trade key | A non-public internal label this study assigned to each closed trade, built from a stable combination of that trade’s own attributes, so the same trade can be recognised when it appears in more than one snapshot. It is not a platform identifier and it is never published. |
| Repeated trade key | A trade that appeared in more than one snapshot. Each one is a chance to check the record against itself: if the same trade shows different values in two readings, the data is not trustworthy. |
| Evidence regime | The kind of record a platform publishes. This study saw two: complete-history evidence (the full closed-trade record, which can be reconciled against the platform’s own lifetime totals) and moving-window evidence (only the most recent N closed trades, with everything older permanently out of view). |
| Visible window | The set of closed trades a moving-window platform is currently showing. On XM Copy Trading this is capped at the most recent 200 closed positions. |
| Window-biased | A visible window that is materially more flattering than the manager’s own reported lifetime figures. Our test: an observed win rate more than 5 percentage points above the lifetime figure, or a window containing less than half of the worst loss the platform itself reports. |
| Evidence coverage | Observed closed trades divided by the platform’s reported lifetime trade count. It answers "how much of this manager’s activity can I actually see?" |
| Disqualifying gate | A rule that removes a manager from this study’s research shortlist before final ranking. Failing one gate is enough. The gates cover insufficient evidence, non-positive edge, failure to survive resampling, decaying edge, severe reported drawdown, martingale and recovery sizing, and other critical hidden-risk behaviour. The full list is in section 10. "Screening gate" and "shortlist exclusion rule" mean the same thing. |
| Critical risk flag | A measured behaviour serious enough on its own to disqualify: hidden drawdown behind a near-perfect win rate, martingale or recovery sizing, realised profit offset by floating losses, no realised losses at all, unsustainable implied leverage, or a reported equity drawdown of 40% or more. |
| Forward realised return | What a manager’s closed trades earned after a chosen cutoff date. Used to test whether the score predicted anything. It is blind to losses that were deferred into positions that stayed open, which matters a great deal later. |
| Holdout | A slice of data deliberately withheld from every design decision, opened once at the end to test the result. A sealed holdout is one whose contents were cryptographically committed before it was opened, so it cannot be quietly reused. |
| Walk-forward | Repeatedly fitting on one period and testing on the next, stepping through time, so a result has to survive many out-of-sample periods rather than one. |
| Smoothed OHLC data | Price history stored as one open, high, low and close per bar. It is a summary: it does not record the path price took inside the bar. |
| Bid/ask model | An execution model built on separate bid and ask prices with real historical spreads, commission and slippage, so a fill is priced the way a broker would actually price it. |
Two figures recur and are worth fixing now. 419 is the number of managers with enough closed-trade evidence to score, out of 430 observed. Where this paper says "of the sample", it means those 419 unless stated otherwise.
4. Why headline statistics mislead: three worked examples
These are real records from the study, anonymised, with figures rounded where precision would add re-identification risk rather than reader value. Each was eliminated by our analysis. Each looked excellent on the surface. None of them is unusual: they are the three commonest failure modes in the whole sample.
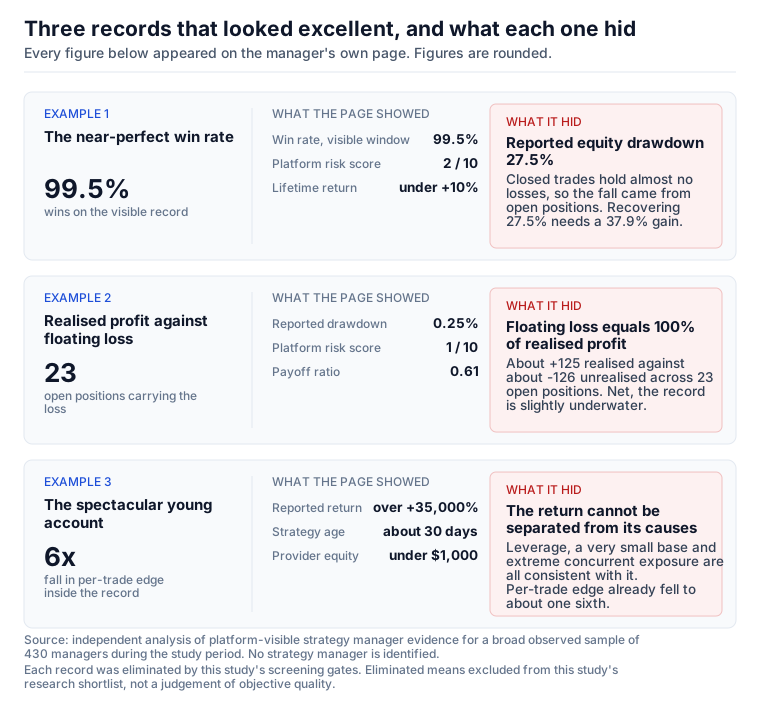
Example 1: the near-perfect win rate that hides a quarter of the account
| What the page showed | Value |
|---|---|
| Closed-trade win rate, visible window | 199 wins in 200 trades (99.5%) |
| Platform’s own lifetime win rate | about 99.8%, across roughly 650 closed trades |
| Platform’s reported maximum equity drawdown | 27.5% |
| Platform’s own risk score | 2 out of 10 |
| Platform’s reported Sharpe ratio | about 0.04 |
| Total lifetime return | under +10% |
| Share of lifetime trades actually visible | about 31% |
| Maximum simultaneous open positions | 19 |
| Share of observed time with a position open | about 82% |
What a naive reader concludes. A manager who wins 199 times out of 200, on a platform that rates its risk 2 out of 10. Almost no losses. Safe.
What the evidence actually says. Two of those numbers cannot both describe a low-risk account. A 27.5% equity drawdown means that at some point the account was worth 27.5% less than its previous peak. The closed-trade record contains essentially no losses, so the fall cannot have come from closed trades. It came from mark-to-market movement on positions that were still open. The winners were realised and appear in the trade history; the losses sat in open positions and appear only in the equity calculation.
Why this is a red flag rather than a reassurance. The closed-trade record and the equity record are telling different stories about the same account. When two figures on the same page disagree, the one that includes unrealised movement is the honest one. A near-perfect win rate is not evidence that losses are rare; it is evidence about which trades the manager chooses to close.
The recovery arithmetic, which is the part most readers skip. A drawdown and the gain needed to undo it are not the same number, and the gap widens fast:
required gain = 1 / (1 - drawdown) - 1| Drawdown | Gain needed to get back to the previous peak |
|---|---|
| 10% | 11.1% |
| 20% | 25.0% |
| 27.5% | 37.9% |
| 40% | 66.7% |
| 50% | 100.0% |
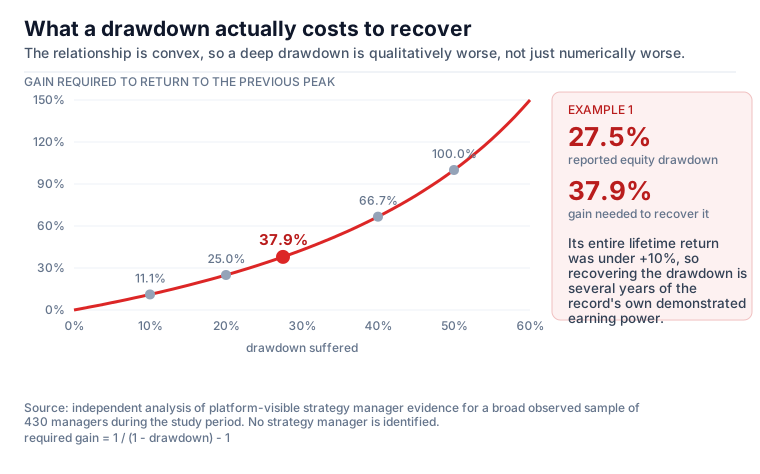
A 27.5% loss requires about a 38% gain to recover. On a record whose entire lifetime return is under +10%, that is several years of the strategy’s own demonstrated earning power, assuming it earns at all. The reported Sharpe ratio of about 0.04 says the same thing in one number: the return is negligible relative to its variability, despite the 99.8% win rate.
What a trader should check next. Open the position list. If the platform shows current positions, check whether they carry material floating loss and how long they have been open. Then compare visible trades against the lifetime trade count: here only about 31% of the record was visible, so the window is a sample chosen by the manager’s own closing decisions, not a record.
Example 2: realised profit and floating loss cancelling out
| What the page showed | Value |
|---|---|
| Realised closed profit | about +125 |
| Floating loss across 23 open positions | about −126 |
| Net position | roughly flat, slightly underwater |
| Closed-trade win rate | 99.5% over 200 visible trades |
| Payoff ratio on closed trades | 0.61 (the average win was smaller than the average loss) |
| Platform’s reported maximum drawdown | 0.25% |
| Platform’s own risk score | 1 out of 10 |
| Reported lifetime return | about +8% |
| Share of lifetime trades visible | about 70% |
| Maximum simultaneous open positions | 21 |
| Share of observed time with a position open | about 97% |
| Observed record length | about 8 weeks |
What a naive reader concludes. A 99.5% win rate, a quarter-of-one-percent drawdown, and the lowest risk score the platform issues. This looks like the safest record on the page.
What the evidence actually says. The realised profit and the unrealised loss are the same size. Every unit of profit in the closed-trade record is matched by a unit of loss sitting in an open position. The strategy has not made money; it has relabelled money. Closed-trade statistics are computed only from the closed side, so the entire loss is outside every performance figure on the page, including the 0.25% drawdown, which is measured on realised balance.
The payoff ratio makes the mechanism explicit. At 0.61, the average winning trade is smaller than the average losing trade. A strategy that wins small and loses big can only show a 99.5% win rate if the big losses are not being closed. And with a position open 97% of the observed time and up to 21 at once, there is always a basket available to absorb them.
Why the drawdown figure is the trap. 0.25% is not wrong. It is a correct measurement of the wrong thing. Balance drawdown by construction excludes unrealised losses. For a strategy that holds losing baskets, it can be made arbitrarily small simply by not closing anything.
What a trader should check next. Add the floating profit and loss on open positions to the realised total before believing any performance figure. If the platform does not show open positions, treat every closed-trade statistic from that manager as unverifiable, not as good.
Example 3: the spectacular young account
| What the page showed | Value |
|---|---|
| Reported return | over +35,000% |
| Strategy age reported by the platform | about 30 days |
| Observed closed trades | 249, over roughly 9 weeks |
| Provider account equity | under $1,000 |
| Reported maximum balance drawdown | 0.12% |
| Win rate | 80.7% |
| Profit factor | 9.66 |
| Record integrity | the record reconciles against the platform’s own reported total |
| First-half versus second-half per-trade edge | 3.5R falling to 0.6R |
| Maximum simultaneous open positions | 18 |
What a naive reader concludes. The best-performing manager they have ever seen, on a record the platform’s own numbers confirm.
What the evidence actually says, stated carefully. This is the example where it is easiest to overclaim, so we will not. The record is genuine: our independently recomputed total reconciles against the platform’s own figure. The win rate and profit factor are real. What cannot be established from the visible fields is why the percentage is so large.
Three explanations are consistent with everything visible, and the evidence does not separate them:
- Leverage. A high notional exposure relative to equity turns ordinary price moves into extraordinary percentages, and a copier inherits leverage in full.
- A very small base. Provider equity was under $1,000. On a base that size, a few hundred units of profit is a four-figure percentage. The percentage says more about the denominator than the trading.
- Extreme concentrated exposure. Up to 18 positions open at once on a single instrument, with widely varying position sizes rather than a fixed fraction.
The honest conclusion is the one we drew at the time: the return could not be separated from leverage, small-base effects, or extreme exposure. We did not claim to know which, and neither should anyone reading the same page.
The part that is not ambiguous. The per-trade edge in the second half of the record was about one sixth of the first half. Whatever produced the number was already decaying inside the record’s own 9 weeks. A 30-day-old account has not traded through enough conditions to have an assessable edge, and an extreme return on a young, small account is the single least informative statistic in copy trading.
What a trader should check next. Divide the reported return by the record’s age before reading it. Then look for the account’s equity base if the platform shows it, and split the record in half to see whether the recent half still performs like the early half. Any of the three checks would have caught this in under a minute.
What the three examples have in common
None of these problems is visible from the headline figures alone. All three become obvious the moment you cross-reference three things that platforms display in three different places: the closed-trade record, the equity-based figures, and the open position list. That cross-reference is the whole of basic copy trading due diligence, and it takes about two minutes per manager.
5. Why martingale and recovery sizing are critical risks in copy trading
Of all the behaviours we measured, one predicted trouble more cleanly than any other: what the manager does with position size immediately after a loss.
What recovery sizing and martingale sizing are. A martingale increases position size after a losing trade, so that a subsequent win recovers the earlier loss as well as making the intended profit. Classic martingale doubles; retail variants use 1.5x, 2x or a custom ladder, and are often described as "recovery", "smart recovery", "averaging" or "grid" sizing. Grid strategies are related but not identical: a grid opens additional positions at fixed price intervals, which produces the same convex exposure build-up even when each individual position is the same size.
How common this is in the observed sample
| Measure | Count | Share of the 419 scored managers |
|---|---|---|
| Primary behavioural classification: grid basket | 109 | 26.0% |
| Primary behavioural classification: recovery or martingale sizing | 99 | 23.6% |
| Either of the above as the primary classification | 208 | 49.6% |
| Eliminated primarily for martingale or recovery sizing | 39 | 9.3% |
| Post-loss position size above 1.4x post-win size | 89 | 21.2% |
| Post-loss position size above 2x post-win size | 31 | 7.4% |
| Post-loss position size at or above 3x post-win size | 15 | 3.6% |
Roughly half the managers we could score run a mechanism whose entire design is to add exposure into an adverse move. That is not a fringe pattern in copy trading. It is close to the median strategy.
The measured escalation distribution
We measured, for every manager, the ratio of typical position size after a losing trade to typical position size after a winning trade. A ratio of 1.0 means sizing is indifferent to the last result.
| Percentile of the 419 scored managers | Post-loss size ratio |
|---|---|
| 50th (median) | 1.00x |
| 75th | 1.27x |
| 90th | 1.80x |
| 95th | 2.40x |
| 99th | 5.59x |
| Maximum observed | 13.79x |
The median manager does not escalate at all. The tail is where the damage lives: one manager in twenty roughly doubles after a loss, and one in a hundred sizes more than five times larger.
What escalation does to the rest of the record
This is the finding that matters, because it shows the trade-off rather than asserting it. Grouping all 419 scored managers by post-loss size ratio:
| Post-loss size ratio | Managers | Median win rate | Median profit factor | Median worst loss, in average wins | Median peak simultaneous positions | Survived our gates |
|---|---|---|---|---|---|---|
| Up to 1.1x | 247 | 77.5% | 2.32 | 5.3 | 10 | 32 |
| 1.1x to 1.4x | 61 | 70.5% | 1.76 | 7.9 | 12 | 9 |
| 1.4x to 2.0x | 58 | 72.4% | 1.74 | 9.4 | 11 | 0 |
| Above 2.0x | 31 | 87.0% | 1.84 | 10.4 | 21 | 0 |
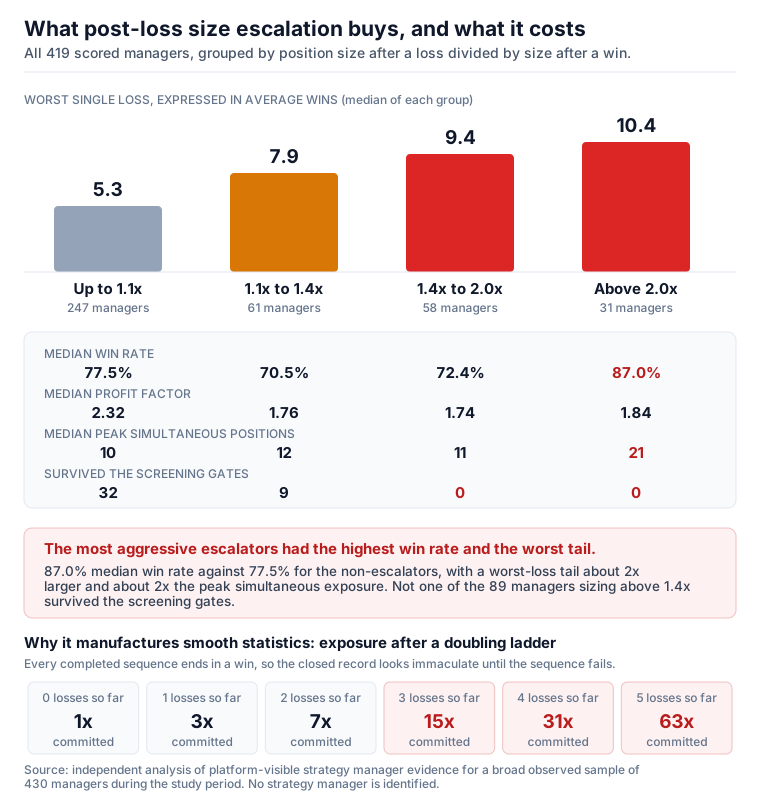
Read the first and last rows together. The managers who escalate most aggressively after losses have the highest median win rate in the entire sample, 87.0% against 77.5% for the non-escalators. They also carry a worst-loss tail roughly 2x larger and roughly 2x the peak simultaneous exposure. Their profit factor is worse, not better.
That is the whole hazard in one table. Post-loss escalation buys a better-looking win rate and pays for it with tail risk and concurrent exposure. The statistic a copier reads improves. The statistic that determines whether the copier’s account survives gets worse.
Not one of the 89 managers sizing above 1.4x after a loss survived our disqualifying gates. Among the managers sizing at or below 1.1x, 32 did.
Why post-loss sizing manufactures smooth statistics
Consider a strategy with no edge at all, trading a coin flip, that doubles after each loss.
| Consecutive losses so far | Size on the next trade | Cumulative exposure committed | Loss if the sequence fails here |
|---|---|---|---|
| 0 | 1x | 1x | 1x |
| 1 | 2x | 3x | 3x |
| 2 | 4x | 7x | 7x |
| 3 | 8x | 15x | 15x |
| 4 | 16x | 31x | 31x |
| 5 | 32x | 63x | 63x |
At any point before the sequence fails, the closed-trade record looks immaculate: every completed sequence ends in a win. The win rate approaches 100%. The equity curve is a smooth staircase. The strategy appears to have solved trading.
The loss distribution has not disappeared. It has been compressed into a tail. Instead of many small losses, there is one enormous loss whose timing is unknown. Five losses in a row is not a rare event in any real market; at a 50% chance per trade it happens roughly once every 32 sequences. When it lands, it removes 31x the base risk in a single sequence, and the record that preceded it gave no warning at all.
Real strategies are not coin flips and rarely double. But the shape is the same at 1.5x, and the observed data shows exactly the predicted signature: escalating managers had the highest win rates and the worst tails.
Why this is worse when you copy it than when you trade it
Three copy-specific amplifiers:
- You inherit the pattern, not the manager’s balance sheet. The manager may be sizing against equity you cannot see. Your account is scaled to your own capital, and the escalation ladder scales with it.
- Concurrency compounds. The escalating group ran a median peak of 21 simultaneous positions against 10 for non-escalators. Simultaneous positions in the same direction are one position wearing a disguise, and they liquidate together.
- Your costs are yours. Every added position pays your spread, your commission and your slippage, not the manager’s. Add-on-heavy strategies pay the cost ladder more times than the displayed return implies.
How to detect it from visible trade history
You do not need the manager’s code. Five checks, all from the trade list:
- Compare typical size after a loss against typical size after a win. Above about 1.4x warrants serious scepticism. Above 2x, treat the record’s win rate as uninformative.
- Look for clusters of same-direction entries at regular price intervals. That is grid structure, whether or not it is labelled as such.
- Check peak simultaneous positions. A record that regularly holds double-digit positions is running basket exposure, not trade-by-trade risk.
- Compare the worst single loss against the average win. In the escalating group the median was 10.4 average wins, meaning one bad sequence undoes ten good trades. Under 1.1x escalation the median was 5.3.
- Read the win rate backwards. A win rate above about 90% with a non-trivial equity drawdown is not an achievement to admire. It is a question to answer: where are the losses?
A grid or recovery strategy is not fraud, and this study does not say it is. These are legitimate, widely used approaches that suit some risk tolerances. The failure is not the strategy. It is ranking it by statistics that its own mechanics are designed to flatter, and then sizing an allocation as if those statistics measured risk.
6. How to evaluate copy trading strategy managers before you copy them
The short answer. Before reading any performance metric, establish what kind of record you are looking at: a complete history and a moving recent window are not comparable evidence. Then cross-check the closed-trade record against the equity-based figures, because a high win rate alongside a non-trivial equity drawdown is the signature of losses deferred into open positions. Challenge a low drawdown rather than admiring it: if it is computed on realised balance, unrealised losses are excluded by construction. Then measure behaviour rather than outcomes (holding-time asymmetry, position sizing after losses, peak simultaneous positions, worst-loss size), and apply hard minimums on trade count and record length before anything else. The ten steps below expand that into a procedure you can run in about ten minutes per manager.
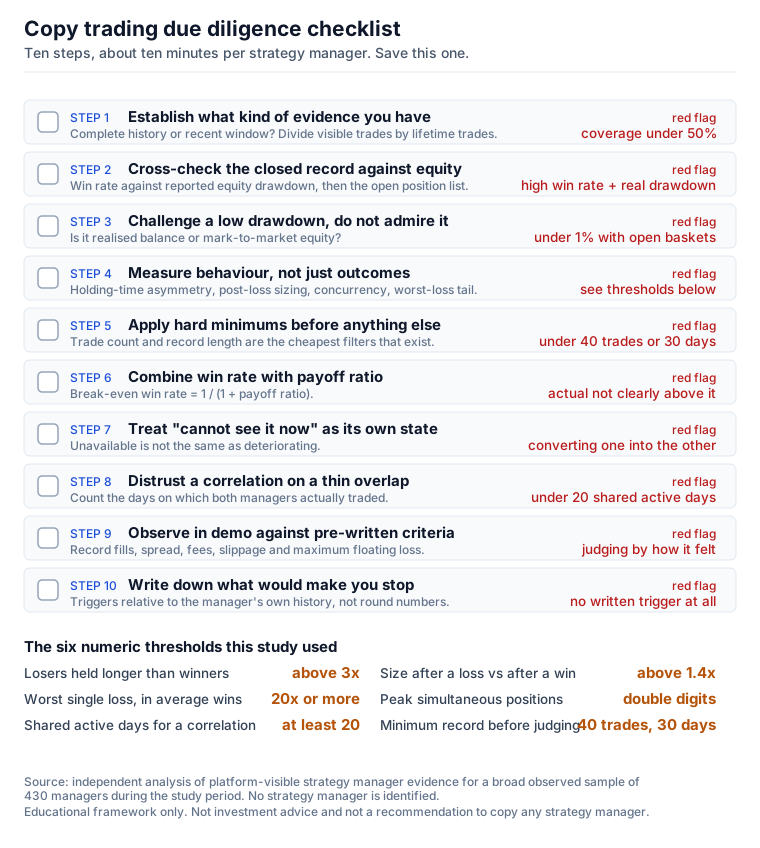
Step 1: establish what kind of evidence you have
What to check. Is this the full trade history or a recent window? Does the platform publish a lifetime trade count? If so, divide visible trades by lifetime trades to get your evidence coverage.
Why it matters. A window is filled by the manager’s own closing decisions, so it is a sample they selected, not a record. See section 7.
Red flag. Coverage below about 50%, or a platform that publishes no lifetime count at all so you cannot compute coverage.
Step 2: cross-check the closed record against the equity record
What to check. Win rate against reported equity or balance drawdown. Then the open position list, if there is one, for material floating loss.
Why it matters. This single step catches the most common hazard in the entire sample.
Red flag. A very high win rate alongside a non-trivial drawdown. In Example 1 that was 99.5% against 27.5%.
Step 3: challenge a low drawdown rather than admiring it
What to check. What the drawdown is computed on: realised balance, or mark-to-market equity.
Why it matters. Balance drawdown excludes open positions by construction. For a grid or averaging strategy it can be close to meaningless.
Red flag. A drawdown under about 1% on a strategy that holds multiple simultaneous positions. Example 2 reported 0.25% while carrying floating losses equal to 100% of its realised profit.
Step 4: measure behaviour, not just outcomes
What to check, in order of how often it changed a conclusion in this study:
| Behaviour | How to measure it | Concern threshold |
|---|---|---|
| Holding-time asymmetry | average losing-trade duration divided by average winning-trade duration | above about 3x |
| Post-loss size escalation | typical size after a loss divided by typical size after a win | above about 1.4x |
| Peak simultaneous positions | largest number open at once | double digits deserves scrutiny |
| Same-side add-ons | share of entries that add to an existing position in the same direction | bounded and conditional is defensible; unbounded averaging is not |
| Worst-loss tail | worst single loss expressed in average wins | 20x or more means one trade undoes a long run |
| Stale open positions | oldest open position age | months-old losers reveal how the manager treats losses |
Why it matters. A score built on returns and risk-adjusted ratios will still rank hazardous managers highly, because their mechanics produce good ratios. Only direct behavioural measurement catches them. See section 12.
Step 5: apply hard minimums before anything else
What to check. Trade count and record length.
Why it matters. These are the cheapest filters that exist and among the most predictive. Our gates required at least 40 closed trades and 30 days as an absolute floor, and in practice we weighted multi-year records far more heavily.
Red flag. Extreme returns on young accounts. A 61-trade, 69-day record with a profit factor of 7.5 is weaker evidence than a 2,358-trade, three-year record with a profit factor of 2.
Step 6: combine win rate with payoff ratio, never either alone
What to check. Compute the break-even win rate and compare it against the actual one:
break-even win rate = 1 / (1 + payoff ratio)Why it matters. A 75% win rate sounds excellent. If the average loss is 4x the average win, break-even sits at 80% and the strategy loses money.
Red flag. An actual win rate that is not comfortably above break-even, before costs.
Step 7: treat "cannot see it right now" as its own state
What to check. Whether an unavailable record is unavailable, or deteriorating. And separately, when you last saw new activity.
Why it matters. We dropped a manager from our own shortlist on a single failed availability check and had to reverse it. See section 13.
Red flag. Your own tendency to convert "I cannot see this" into "this has got worse". They require opposite responses: one is a reason to look again, the other a reason to stop.
Step 8: do not trust a correlation computed on a thin overlap
What to check. The number of days on which both managers actually traded.
Why it matters. Diversification only helps if the managers are genuinely independent, and that is harder to establish than it looks.
Red flag. Fewer than about 20 shared active days. And remember that no correlation measured in calm conditions tells you what happens during a liquidation event.
Step 9: observe in demo before funding, against pre-written criteria
What to check. Fills, spread, fees, slippage, maximum floating loss, and any change in manager behaviour, over a defined period.
Why it matters. Demo observation converts several assumptions into measurements. It reveals copy slippage and actual fee drag, which never appear in a displayed return.
Red flag. Deciding against how the period felt rather than against criteria you wrote down before you started.
Step 10: write down what would make you stop
What to check. Removal triggers, defined relative to the manager’s own demonstrated history rather than round numbers:
- drawdown exceeding about 1.5x their historical maximum;
- a losing streak beyond their historical maximum plus three;
- size after losses rising above about 1.4x size after wins;
- losers suddenly held more than 3x as long as winners;
- floating loss exceeding half the profit earned since you started;
- trading migrating to instruments absent from the historical record.
Why it matters. The decision to stop is the one you are least capable of making well while it is happening.
Red flag. Having no written trigger at all. That is the default state, and it is why most copy allocations end by exhaustion rather than by decision.
7. The evidence-quality asymmetry: cTrader Copy and XM Copy Trading
This is the most important methodological finding in the study, and the one most likely to be useful to a reader evaluating managers on their own.
In this study, the cTrader Copy records available to us behaved like complete-history evidence, while the XM Copy Trading records available to us behaved like a moving-window evidence regime. Both are documented product behaviours, neither is a criticism of either platform, and neither is a statement about any individual manager. But they are not the same kind of evidence, and treating them as if they were is the most consequential mistake available to a copy-trading investor.
Complete-history evidence: what cTrader Copy gave us. For managers here, the full closed-trade record was available and reconciled against the platform’s own reported lifetime figures. In one verified case the net profit we computed independently from the trade record matched the platform’s reported figure to the cent. When your independently recomputed total agrees with the platform’s total, you have strong evidence that you are seeing the whole record. All 69 scored cTrader Copy managers had full-history records; 66 of them reached our top evidence class.
Moving-window evidence: what XM Copy Trading gave us. Here the visible trade history was capped at the most recent 200 closed positions. Anything older had left the window. You can accumulate more by observing repeatedly over time, and we did, but you cannot recover what closed before observation began. Across the 350 scored XM managers, the median record showed about 66% of the manager’s lifetime trades, and the bottom tenth showed under 15%.
Now combine that with the deferred-loss pattern from section 4. A manager that closes winners promptly and holds losers open will, in a moving window of recent closes, appear systematically better than it is, because the window fills up with the trades the strategy chose to close, and the trades it chose not to close are invisible to it by construction.
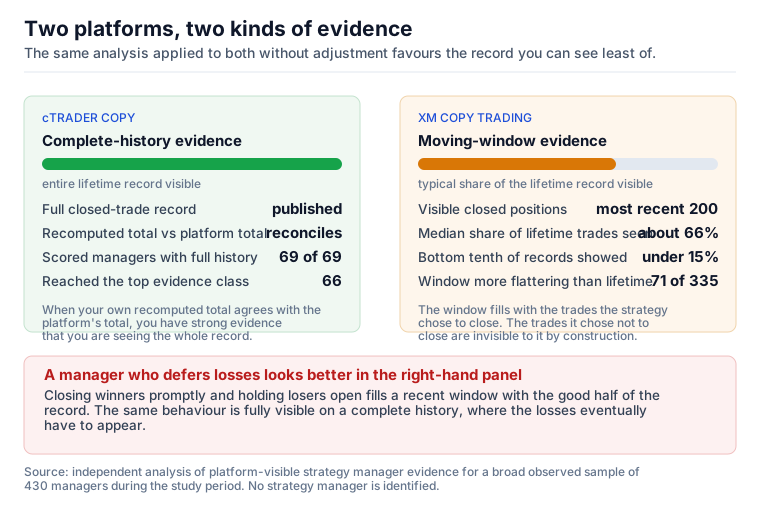
That is not a hypothesis. In our sample, 71 of 335 managers on the windowed venue showed a visible window materially more flattering than their own lifetime figures: an observed win rate more than 5 points above the lifetime figure, or a window containing less than half of the worst loss the platform itself reported.
The methodological response was to classify every manager by evidence quality before scoring anything:
| Class | Meaning | Where it was achievable |
|---|---|---|
| Authoritative | Full history; independently recomputed totals reconcile with platform-reported figures | complete-history records only |
| Representative | Visible window broadly consistent with lifetime figures | either regime |
| Window-biased | Visible window materially more flattering than the lifetime record | windowed records only |
| Insufficient | Fewer than 30 observed trades | either regime |
Evidence quality then scales the final score. A flattering window cannot buy a top ranking. Every surviving manager on the complete-history side was authoritative; no windowed record can be, by construction. That is a structural ceiling on confidence, not a criticism of any individual manager.
What "a higher bar" actually meant
The general advice "require more from a windowed record" is useless without criteria. Here are the six the study actually applied to a moving-window record before it could be trusted:
- Consistency with the platform’s own lifetime statistics. The observed win rate could not exceed the reported lifetime win rate by more than 5 percentage points, and the visible window had to contain at least half of the worst loss the platform itself reported. Failing either marked the record window-biased.
- A score penalty, not a warning label. A window-biased classification scaled the manager’s final score downwards. It could not be offset by strong performance figures, because the point is that those figures are the thing in doubt.
- A confidence ceiling. No windowed record could reach the top evidence class, however good it looked, so its confidence rating was capped below that of a comparable complete-history record.
- A longer observation span. Time observed had to compensate for depth not visible. The windowed manager that survived to our shortlist had 378 days of retained evidence, not a recent burst.
- No open-position risk at the point of assessment. Zero open exposure was required before a windowed record was treated as trustworthy, because the window cannot show you the losses that never closed.
- A smaller allocation and controlled demo observation first. In the illustrative allocation, the windowed record sat below the complete-history record of comparable quality purely because of the evidence regime, and demo observation preceded any confidence.
The practical lesson for readers: before comparing two managers, ask whether you are seeing the same kind of evidence for both. If one record is complete and one is a recent window, the windowed record has to clear the six points above, not merely match the other record’s numbers.
8. Scope: what evidence we actually had
| Strategy managers observed during the study period | 430 |
| Split by platform (cTrader Copy / XM Copy Trading) | 76 / 354 |
| Managers whose evidence resolved to a data-bearing state | 428 |
| Managers with enough closed-trade evidence to score | 419 |
| Closed trades in the consolidated record | 112,498 |
| Split by platform | 50,855 / 61,643 |
| Open positions observed at final reading | 1,913 |
| Managers surviving every disqualifying gate (primary pipeline) | 41 |
| Managers eliminated from the study’s research shortlist | 378 |
How the record was checked against itself. A manager’s visible record was read more than once, so the same closed trade can appear in more than one observation snapshot. To avoid counting a trade twice, each closed trade was assigned a trade key: a non-public internal label built from a stable combination of that trade’s own attributes, used only to recognise duplicates inside the research dataset. 43,125 trades appeared under a repeated trade key, and every one was compared across its appearances. None had conflicting values. That is a consistency check on the dataset, and nothing more: it says the record did not change underneath us between readings.
What this sample is, and is not. These 430 are the managers visible to the study during the observation period. That is a broad observed sample, not a census: it is not the complete live directory of either platform, and no figure here should be read as a statement about every manager available to you today. Two things make it strong enough to draw conclusions from. First, its size: 419 scored managers and roughly 112,500 closed trades is enough that the recurring patterns described in this paper are not artefacts of a thin sample. Second, its resolution: evidence resolved to a data-bearing state for 428 of the 430, so the sample is not quietly missing the managers that were hardest to assess.
What it cannot do is describe a directory that changes continuously. Managers join, leave, pause, restrict their visibility, become temporarily unavailable, or change how they trade. A manager absent from this sample is not thereby better or worse than one in it.
Two further caveats, both surfaced by the independent audit rather than by the pipeline that produced the numbers:
- 419 is not the whole observed sample. It is the subset with sufficient realised-profit evidence to score. Nine managers, seven on one platform with too few profit observations and two on the other with metadata only, fall outside it. "419 scored" is accurate; "419 analysed" would overstate it, and "all managers" would be plainly wrong.
- The consolidated record is not a perfect union. One trade observed repeatedly in the underlying evidence is absent from the consolidated ledger: 112,498 against 112,499 distinct keys. It changes nothing in any ranking, and we report it because a study that claims perfect data integrity without checking is not a study you should trust.
9. The metrics, defined properly
Copy trading pages use these terms loosely. Here is what each actually measures and where each fails. Plain-English definition first, formula second.
Win rate: the share of closed trades that made money.
win rate = winning trades / total closed tradesFails when: losers are held open rather than closed. Win rate says nothing about the size of wins versus losses, so it is uninformative on its own and actively misleading when paired with asymmetric holding behaviour.
Payoff ratio: how big the average win is relative to the average loss.
payoff ratio = average win / average lossWin rate and payoff ratio are only meaningful together. A strategy needs
win rate > 1 / (1 + payoff ratio)to break even before costs. A 75% win rate sounds excellent, but if the average loss is 4x the average win, break-even sits at 80%, and the strategy loses money.
Profit factor: gross profit divided by gross loss, over the same period.
profit factor = sum of winning trades / |sum of losing trades|Above 1.0 means the record made money. Fails when: the losing side is incomplete. Unclosed losers are simply not in the denominator, so a profit factor computed from a window that excludes open losing positions can be arbitrarily high and mean nothing. Two of the three worked examples in section 4 showed three-figure profit factors on records that were flat or underwater.
Maximum drawdown: the largest peak-to-trough decline.
drawdown(t) = (peak equity up to t - equity at t) / peak equity up to t
max drawdown = maximum of drawdown(t) over the period
The critical subtlety: if "equity" means realised account balance, unrealised losses on open positions never enter the calculation. A grid or averaging strategy can report a 1% to 2% balance drawdown while carrying far larger open exposure. If it means mark-to-market equity, it captures the real experience. Platforms differ. Always check which one you are reading.
Recovery arithmetic: the gain required to undo a drawdown.
required gain = 1 / (1 - drawdown) - 1A 20% drawdown needs 25% to recover; 27.5% needs 37.9%; 50% needs 100%. The relationship is convex, which is why deep drawdowns are qualitatively, not just quantitatively, worse than shallow ones.
Recovery factor: net profit divided by maximum drawdown; how much return was earned per unit of worst-case pain.
recovery factor = net profit / max drawdownFails when: the drawdown denominator is understated, which inflates it in exactly the cases where you most want it to be honest.
Evidence coverage: how much of a manager’s stated lifetime activity you can actually see.
evidence coverage = observed closed trades / platform-reported lifetime tradesA manager with 200 visible trades against 252 reported has about 79% coverage. One with 61 visible trades over 69 days has a short record regardless of coverage. Both matter, and they are different questions.
Post-loss size ratio: whether the manager adds risk after losing.
post-loss size ratio = typical position size after a loss / typical position size after a winAt 1.0 the manager is indifferent to the last result. Above about 1.4x, treat the win rate as uninformative until you understand why. See section 5.
Holding-time asymmetry: whether losers are held longer than winners.
holding-time asymmetry = average losing-trade duration / average winning-trade durationAbove about 3x, the manager is mechanically converting would-be losses into open positions. This single ratio explains a great deal of what makes very high win rates possible.
Worst-loss tail: the worst single loss expressed in units of average win.
worst-loss tail = |worst single loss| / average winA manager whose worst loss equals 24 average wins needs a long run of wins to recover from one bad trade. Average metrics hide this entirely; it is a property of the tail.
Active-day correlation: whether two managers lose money at the same time.
Take each manager’s daily profit or loss, standardise it by that manager’s own typical trade size so the two are comparable, and correlate the two series across days when both were active:
r = corr( standardised daily P/L of A , standardised daily P/L of B )Fails when: the overlap is thin. A correlation computed over 14 shared active days is not an estimate you should allocate on. We required at least 20 shared days before trusting a figure, and even then treated it as weak evidence, because the correlation that matters is the one during a crisis, and crises are rare in any short sample.
Risk per trade and open-risk cap: the two numbers that govern position sizing.
position size = (account equity * risk fraction) / (stop distance in pips * pip value)
total open risk = sum over open positions of (entry - stop) * size
An open-risk cap limits the second quantity, so that several simultaneous positions cannot combine into an exposure none of them would have created alone.
10. Pipeline one: forensic manager analysis
The primary analysis was a deterministic pipeline: same inputs, same outputs, byte-identical across runs, with every result regenerable from the stored evidence.
Roughly 50 features per manager, all scale-free. Every profit was normalised by that manager’s own median absolute trade result, so a manager trading small and one trading large are directly comparable. The features spanned:
- performance: profit factor, expectancy, payoff ratio;
- risk and tails: drawdown, ulcer index (a measure of how deep and how long drawdowns run), skewness, worst-loss ratios, losing streaks;
- statistical strength: bootstrap confidence floors with a fixed seed, t-statistic, daily-aggregated Sharpe;
- stability over time: first half versus second half, rolling-block profitability, trend slope;
- execution behaviour: holding times, concurrency, size escalation after losses, grid clustering.
Behavioural classification. Each manager was assigned a data-derived archetype describing what the trade record is consistent with: not what the manager says they do, and not a claim to know their actual method. The taxonomy came from where managers genuinely cluster in the data: deferred-loss accumulator, martingale or recovery, grid basket, high-frequency scalper, intraday directional, swing positional, trend runner, mean-reversion fader, news-event burst, low-activity selective, diversified systematic, single-instrument specialist.
Crucially, measured mechanics and inferred conclusions were stored in separate fields, each inference carrying its own confidence. A directly measured fact (median holding time, share of same-side add-ons, maximum concurrency) is never presented as equivalent to a reasoned inference about strategy type.
Scoring used five weighted components against absolute anchors rather than peer percentiles: statistical edge (24%), risk-adjusted return (20%), drawdown control (20%), consistency (18%), tail safety (18%). Using absolute anchors matters: a manager’s score depends only on its own evidence, so it does not change when the peer set changes, and the method never manufactures a "top 10" out of a weak field.
Disqualifying gates were exclusions, not deductions. A manager was removed outright for any one of:
- fewer than 40 observed trades, or under 30 days of history;
- profit factor at or below 1.05, or non-positive expectancy;
- a bootstrap 5th-percentile profit factor below 1, meaning the record does not survive resampling;
- an edge that decays to negative in its second half;
- any critical risk flag: hidden drawdown behind a near-perfect win rate, martingale or recovery sizing, profit offset by floating losses, no realised losses at all, unsustainable implied leverage, or a reported equity drawdown of 40% or more.
What "eliminated" means here. It means removed from this study’s research shortlist, under this study’s gate definitions, on the evidence visible at the time. It is not a judgement that a manager is objectively bad, unsuitable for every investor, or doing anything improper. Many eliminated records belong to strategies that are working as designed: grid and averaging methods, for instance, are legitimate approaches whose risk simply does not fit the profile this study was screening for. A different set of gates, or a different investor’s risk tolerance, would produce a different shortlist.
The elimination breakdown, in that light:
| Primary elimination reason | Managers | Category |
|---|---|---|
| Short observed history | 113 | insufficient evidence |
| Not robust to resampling | 59 | statistical weakness |
| Hidden drawdown behind near-perfect win rate | 41 | behavioural hazard |
| Martingale or recovery sizing | 39 | behavioural hazard |
| Too few observed trades | 38 | insufficient evidence |
| No realised edge (profit factor at or below 1.05) | 37 | no edge |
| Severe reported equity drawdown (40% or more) | 26 | risk level |
| Unsustainable implied leverage | 19 | behavioural hazard |
| Profit offset by floating losses | 3 | behavioural hazard |
| Decaying edge | 2 | statistical weakness |
| No realised losses ever | 1 | behavioural hazard |
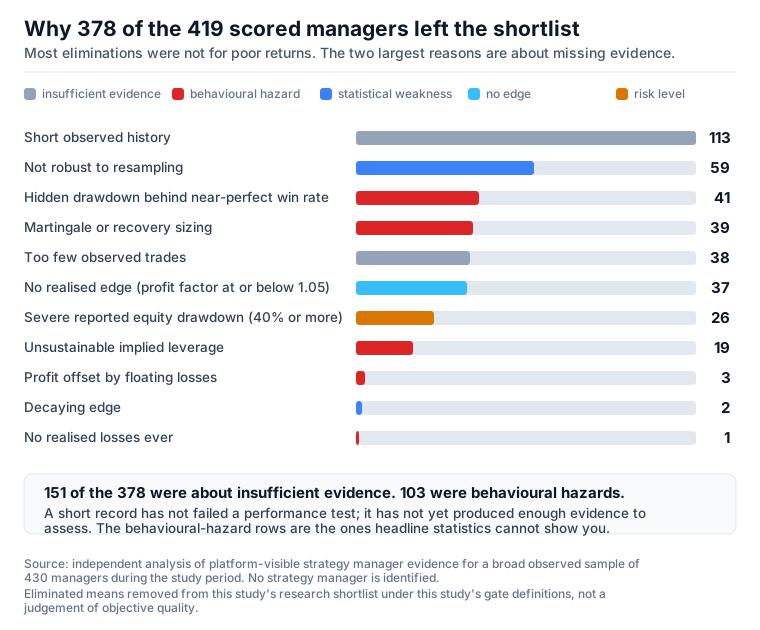
378 of the 419 scored managers were eliminated by this study’s disqualifying gates, and 276 of those 419 carried at least one critical risk pattern under this study’s definitions. Grid mechanics were the primary classification for 109 managers and recovery or martingale sizing for 99. Seventy showed the deferred-loss signature directly.
Note what dominates that table. The two largest categories, 113 and 38, are about insufficient evidence, not bad behaviour: together they are 151 managers, 40% of all eliminations. A manager with a short record has not failed a performance test; it has simply not yet produced enough evidence to assess. The behavioural-hazard rows total 103, and those are the ones the headline statistics cannot show you.
Did the score actually predict anything? This was tested by chronological holdout: compute the score using only trades closed before a cutoff, then measure what happened afterwards. Platform statistics and open positions were withheld from the training view to prevent look-ahead. Four cutoffs were used, spaced across roughly the final two months of the study window:
| Cutoff | Managers | Rank vs forward (Spearman) | Top-quintile forward | Bottom-quintile forward |
|---|---|---|---|---|
| 1 (earliest) | 108 | 0.31 | 1.07 | 0.27 |
| 2 | 131 | 0.39 | 1.15 | 0.30 |
| 3 | 160 | 0.40 | 1.33 | 0.34 |
| 4 (latest) | 156 | 0.39 | 1.60 | 0.77 |
The continuous score carried a positive rank correlation with forward performance at every cutoff, and the top quintile earned 2x to 5x the forward return of the bottom. Under equal, risk-dominant, return-dominant and consistency-dominant weightings, the top ten retained 9 or 10 of its 10 members, so the ranking is not an artefact of the chosen weights.
*But the independent audit was right to press on this: the gates were not validated the same way.* Forward realised return cannot detect losses deferred into open positions, which is the exact blind spot the gates exist to cover. We return to this in section 12.
11. Pipeline two: an independent blind audit
The second analysis was run deliberately blind. It consumed only the raw evidence, and did not open the first pipeline’s outputs, scores, rankings, reports or code until its own results had been computed, fingerprinted and committed. That commitment is what makes the comparison meaningful: neither pipeline could quietly converge on the other.
Its method differed substantively. Rather than weighted components, it used an equal-component geometric aggregate of five factors: realised edge and bootstrap evidence, chronological persistence, combined realised, platform and open-position risk, evidence completeness, and copyability or execution characteristics. A geometric aggregate has a useful property here: a manager cannot compensate for one very weak dimension with strength elsewhere, because a near-zero factor drags the whole product down.
It also kept eligibility separate from ranking, and penalised deferred losses, stale open positions, observable recovery and grid behaviour, concentration, fragile profits, weak recent results, incomplete status and minimum-investment mismatch.
It produced 40 eligible managers, 17 and 23 across the two platforms, against the first pipeline’s 41. Similar count, different membership.
12. Where the two pipelines disagreed
This is where the study earns its keep.
Agreement was thin at the top. Only one manager appeared in the top five of both: Manager Alpha, the long-record mean-reversion specialist. Of the blind pipeline’s top three, all three were subsequently rejected or downgraded once the forensic hazard features were applied:
- Manager Zeta ranked first blind on an extreme annualised return with a reported drawdown under 3%. It was downgraded to demo-observation-only: on the available fields, that result cannot be separated from leverage, and a copier inherits leverage in full.
- Manager Eta ranked second blind. The forensic pipeline measured position sizing roughly 3x larger following losses, a recovery-sizing signature, alongside an implied annualised return in the four figures. Rejected.
- Manager Theta ranked third blind. It combined extreme annualisation with 52.6% same-side add-ons and peak concurrency of eight. Rejected.
- Manager Iota ranked seventh blind and was rejected on 1.63x post-loss sizing.
The lesson generalises: a well-constructed score built on returns and risk-adjusted ratios will still rank hazardous managers highly, because their mechanics produce good ratios. Only explicit behavioural detection, measuring what the manager does after a loss, how much exposure overlaps, and how long losers are held relative to winners, catches them.
The audit pushed back just as hard in the other direction, and was right to.
- The gates were not forward-validated. Eligible managers’ forward expectancy was worse than eliminated managers’ at three of four cutoffs. Risk-gated forward drawdown was better at the first two cutoffs and worse at the last two. The honest conclusion: "the continuous score has moderate forward rank signal" is supported by the evidence; "the eligibility and risk gates are forward-validated" is not. We report the second claim as unproven.
- The bootstrap assumption was too strong. Resampling individual trades independently assumes they are independent. Grid baskets, regime clusters and batched copied orders are serially dependent, so an independence-based lower bound can be optimistically biased.
- The five score components are not five independent confirmations. They are derived from the same profit-and-loss series, so agreement between them is partly structural.
- A size proxy is not size. On the complete-history platform, trade volume is not published at all, for all 50,855 trades. The first pipeline inferred a within-manager size proxy from the ratio of profit to price movement, which is proportional to position size for a given instrument. That is genuinely useful for detecting dramatic recovery sizing within one manager’s own record. It is not volume, and must never be described as volume or used to compare across managers.
How the disagreements were resolved. Not by averaging the two rankings, which would have been meaningless. The resolution rule was: a manager must survive both the ranking logic and the behavioural hazard tests. Rank tells you where to look; hazard detection tells you what to exclude. Where they conflicted, exclusion won.
13. The availability correction
One episode deserves its own section, because the mistake is easy to make and expensive.
Manager Beta, a gold intraday specialist with the strongest record on the windowed side, was the top-ranked manager in the first pipeline and the largest single allocation in its proposed portfolio. In a later evidence refresh, the manager’s record came back as unavailable. The audit concluded, reasonably on that evidence, that the manager was not established as currently copyable, and rejected the portfolio that depended on it.
A follow-up check found the manager present, active and copyable. The earlier failure had been a temporary evidence-availability problem, not a signal about the strategy.
The corrective analysis then did the right thing: instead of simply reinstating the manager, it re-examined what the retained evidence actually said.
- The visible window was exactly the previously retained window: 200 closed trades, spanning from mid-2025 to mid-July of the study window. Stored and current trade identifiers matched 200 of 200, with zero new, zero missing, and zero field conflicts.
- Current open positions: zero. No hidden basket had accumulated.
- Window profit factor 2.73, win rate 65%, over 378 days of retained evidence.
- Investor count had declined modestly, by about 5%, and invested capital by roughly 2%.
That no newer closed trades were visible at the final observation point is freshness uncertainty, not evidence loss, and a modest decline in investors is not evidence of strategy deterioration. There was no behaviour change, no new open basket, and no deterioration in the closed-trade record.
The general principle: availability and freshness are separate axes from quality and deterioration. An evaluation should record "I currently cannot see this" as its own state, and must not silently convert it into "this has got worse." The two demand completely different responses: one is a reason to look again, the other is a reason to stop.
There is a second lesson embedded in the correction. When Manager Beta was reinstated, its corrected score placed it 13th on its own platform and 22nd across both, yet it was still selected for the shortlist over managers ranked above it. That is not inconsistent. Rank and portfolio construction answer different questions. Rank asks "how strong is this record?" Portfolio construction asks "which combination can this capital actually fund, with acceptable correlation and acceptable hazard?" Several higher-ranked managers had far shorter evidence, or behaviour incompatible with a small account, or minimums that would consume the entire allocation.
By comparison, Manager Delta, which the audit had proposed as Manager Beta’s replacement, carried a very high observed profit factor of 7.55 but only 61 trades over 69 days and a reported drawdown of 18.9%. Substituting a short, high-drawdown record for a 378-day one, on the strength of a single failed availability check, was the wrong trade. The corrected analysis reversed it.
14. The final shortlist, profiled
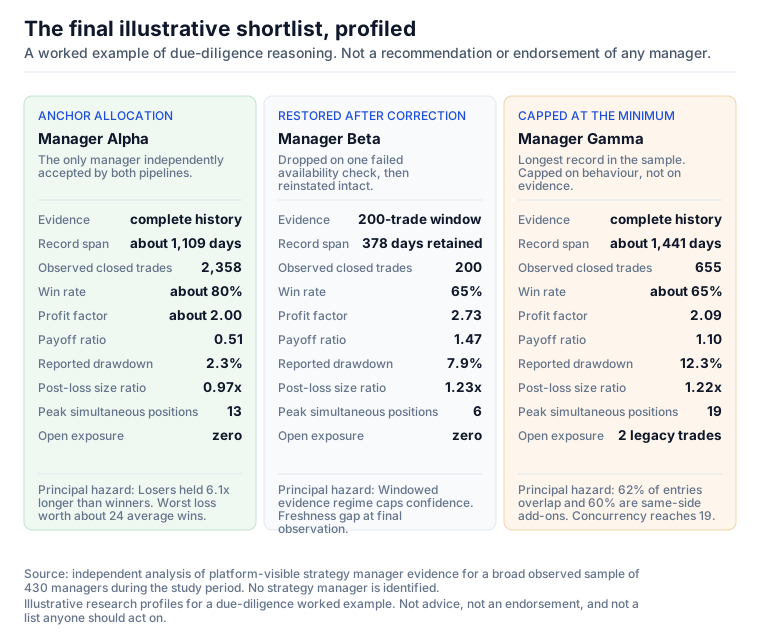
The final illustrative shortlist was three managers: Alpha, Beta and Gamma. Alpha was the strongest final research case and the highest-confidence candidate for controlled demo observation. Beta was restored after the availability and freshness correction described above. Gamma was capped at the minimum because of measured overlap, add-on and deferred-exit hazards.
Strategy-manager profiles used in the final illustrative shortlist
| Manager Alpha | Manager Beta | Manager Gamma | |
|---|---|---|---|
| Role in the study | anchor allocation; the only manager independently accepted by both pipelines | the availability-correction case; restored to the shortlist | longest record in the sample; capped deliberately |
| Evidence regime | complete history | 200-trade moving window | complete history |
| Evidence class | authoritative | representative | authoritative |
| Record span | about 1,109 days (roughly 3 years) | 378 days of retained evidence | about 1,441 days (roughly 4 years) |
| Observed closed trades | 2,358 | 200 (the full visible window) | 655 |
| Instrument concentration | single FX cross | gold-dominant, small number of instruments | single FX pair dominant |
| Win rate | about 80% | 65% | about 65% |
| Profit factor | about 2.00 | 2.73 | 2.09 |
| Payoff ratio | 0.51 (wins smaller than losses) | 1.47 | 1.10 |
| Reported drawdown | 2.3% | 7.9% | 12.3% |
| Post-loss size ratio | 0.97x (no escalation) | 1.23x | 1.22x |
| Peak simultaneous positions | 13 | 6 | 19 |
| Open exposure at final observation | zero | zero | two legacy positions, about −0.38 total |
| Principal hazards | losers held 6.1x longer than winners; worst loss worth about 24 average wins | windowed evidence regime; freshness gap at final observation | 62% of entries overlap; 60% are same-side add-ons; concurrency 19 |
| Why included, or why capped | deepest and most reconcilable evidence in the sample | clean record, zero open risk, long retained span | evidence quality would earn more; behaviour caps it at the minimum |
Illustrative research profiles for a due-diligence worked example. Not a recommendation or endorsement of any manager, and not a suggestion that any reader should copy anyone.
How the allocation was reasoned
Three portfolios were proposed across the study. Showing all three, and why they changed, is more useful than showing only the last, because nothing about the underlying records changed between them.
| Manager Alpha | Manager Beta | Manager Gamma | Manager Delta | Manager Epsilon | Reserve | |
|---|---|---|---|---|---|---|
| Initial | $402 | $372 | $225 | . | . | $1 |
| Post-audit revision | $500 | . | . | $250 | $100 | $150 |
| Corrected final | $450 | $350 | $100 | . | . | $100 |
Illustrative research allocation on a nominal $1,000, for controlled demo observation only. This is a worked example of allocation reasoning, not a recommendation or endorsement of any manager.
Manager Alpha: the anchor allocation, on evidence rather than returns. Note what it did not win on. Its per-trade edge is the lowest of the shortlist, and its payoff ratio of 0.51 means its average win is about half its average loss. It receives the anchor weight because its evidence is the deepest and most reconcilable, and because two methods that disagreed about almost everything else at the top of the ranking both kept it. That is the whole thesis of this paper applied to a single decision.
It is also not low risk, and the study says so plainly: losing trades are held about 6.1x longer than winners, the worst single loss is worth about 24 average wins, and overlapping exposure reaches 13 simultaneous positions. Any copier would need an account-level equity stop.
Manager Beta: restored to the shortlist. It sits below Alpha because the windowed evidence regime caps confidence structurally, not because of anything in its record. On the six criteria in section 7 it cleared all six: consistent with lifetime figures, long retained span, zero open exposure, and a smaller allocation with demo observation first.
Manager Gamma: capped at the minimum, deliberately. This manager has the longest record in the observed sample, 655 trades across 1,441 days of fully reconciling history, profit factor 2.09. On evidence quality alone it would deserve more. It is capped because its behaviour is the most hazardous of the three: 62% of entries overlap, 60% are same-side add-ons, and peak concurrency reaches 19. It also carried two small legacy positions, one open for well over a year, aggregating to about −0.38 against more than 6,170 in observed closed profit.
That last figure matters for calibration in both directions. The stale positions are not a material hidden loss, and an earlier assessment that treated them as sufficient to reject the entire portfolio was an overreaction. But they do directly demonstrate deferred-exit behaviour. The proportionate response is neither rejection nor indifference: it is a minimum-sized allocation, which is to say participate, and cap the exposure.
Why the weights changed at all. Between the three versions, no manager’s underlying record changed. What changed was the interpretation: an availability state was corrected; a measured hazard was priced as a cap rather than used as a veto; and an operational reserve was introduced. The final allocation holds $100 unallocated, not as risk capital but as a buffer for platform friction, minimum-investment changes and freshness checks. The initial portfolio’s $1 reserve was, in hindsight, an optimisation artefact rather than a decision.
On correlation. Standardised daily profit-and-loss correlations across the shortlist were approximately 0.02 (Alpha and Beta, over 50 shared active days), 0.08 (Alpha and Gamma, over 87 shared days) and 0.04 (Beta and Gamma, over only 14 shared days). The first two are useful evidence of low realised dependence. The third is not: 14 shared days is too thin, below our own 20-day threshold, and we flag it rather than quoting it as diversification. No correlation measured on calm days predicts correlation during a liquidation event.
To restate the framing, because it matters: this shortlist is an illustrative due-diligence outcome on an observed sample, produced to test a method. It is not advice, not an endorsement, and not a list anyone should act on. What is intended to transfer is the reasoning: deepest evidence earns the anchor weight, structurally limited evidence earns less, measured hazard earns a cap rather than a veto, and thin correlation estimates get flagged rather than trusted.
15. The risk features that actually mattered
Ranked by how often they changed a conclusion in this study.
Deferred-loss accumulation. The dominant pattern: closing winners while holding losers open. The closed record looks near-perfect; the equity-based drawdown is the only tell. Seventy managers showed the signature. Detect it by comparing win rate against reported equity drawdown, and by checking whether open positions carry material floating loss.
Post-loss size escalation. Position size rising after losing trades: recovery or martingale behaviour. It produces smooth equity curves until it does not. Two managers rejected in this study showed roughly 3.0x and 1.63x median size increases following losses, and across the whole sample the escalating group carried a worst-loss tail about 2x that of the non-escalators. Detect it by comparing typical size after a loss against typical size after a win. Above about 1.4x warrants serious scepticism. Full analysis in section 5.
Overlapping entries and same-side add-ons. Multiple positions open simultaneously in the same direction. This is not automatically bad, and our own research found bounded overlap genuinely improved risk-adjusted returns, but it multiplies exposure to a single adverse move. The distinction that matters is whether add-ons are bounded and conditional (a limited number, each requiring a stronger signal than the last) or unbounded averaging (adding indefinitely to a losing position). Shortlisted managers ranged from 29.6% to 60.2% same-side add-ons, with peak concurrency from 13 to 19.
Holding-time asymmetry. The ratio of losing-trade duration to winning-trade duration. A manager holding losers 6x longer than winners is, mechanically, converting a would-be loss into a lengthy open position. This single ratio explains a great deal of what makes very high win rates possible.
Loss tails. The worst single loss expressed in units of average win. A manager whose worst loss equals 24 average wins needs a long run of wins to recover from one bad trade. Average metrics hide this entirely; it is a property of the tail.
Peak concurrency. The largest number of positions open at once. It sets the worst-case simultaneous exposure you inherit, and in this sample it scaled almost exactly with post-loss size escalation: a median of 10 among non-escalators against 21 among managers sizing above 2x.
Manager age and trade count. The two cheapest and most reliable filters available. A 61-trade, 69-day record cannot support a confident conclusion regardless of how good the ratios look. Our gates required at least 40 trades and 30 days as a floor, and in practice we weighted multi-year records far more heavily.
Stale open positions. Positions left open for extended periods. Individually they may be immaterial; as a behavioural signal they reveal how a manager treats losers.
Active-day overlap and correlation. Discussed in sections 9 and 14. The key discipline is refusing to quote a correlation computed on too few shared days.
16. From observed behaviour to a testable market hypothesis
The second half of the project asked a different question. If observable trade behaviour reveals something about the market conditions a manager tends to trade in, is that something independently valuable as a public market hypothesis, testable by anyone, on data anyone can buy?
To be explicit about what this is and is not: the study did not obtain, request, purchase, infer or attempt to reproduce any manager’s method. It observed one measurable characteristic of a public trade record, converted that characteristic into a generic hypothesis about market behaviour, and then tested the hypothesis on its own merits with no reference to the manager at all. The manager research told us where to look. It did not supply a strategy, and nothing in this section describes one.
We looked at Manager Alpha’s record, a single-instrument specialist trading one FX cross, because it had by far the deepest and most reliable evidence in the observed sample.
What was independently established. Comparing the record’s entry timestamps against matched no-trade control periods, in a leak-free design that controlled for time of day so that "entries happen during active hours" could not masquerade as an edge, produced a clear and statistically overwhelming result:
- roughly 77.6% of buy entries occurred below the 20-period moving average, and 71.5% of sells above it;
- median signed 60-minute price displacement at entries was about −9.6 pips, against −0.1 pips for matched controls;
- median signed 60-minute z-score was −1.919 at entries, against 0.005 for controls, with about 94.3% of signed z-scores negative;
- every tested displacement horizon from 5 to 120 minutes was overwhelmingly significant.
The conclusion is narrow and we state it narrowly:
On this instrument, entries in this record usually occur against a statistically extreme recent price displacement.
That is a behavioural characteristic inferred from observable evidence. It is emphatically not the manager’s strategy, and we make no claim to know what that strategy is. It says nothing about instrument selection, entry timing within the extension, position sizing, basket management, or exit discretion. Two independent analyses, using different price data at different resolutions, agreed on this one fact and agreed that it was nowhere near enough to reproduce anything.
What the analysis also revealed, and this turned out to be the important part. The record’s roughly 80% win rate is not produced by entry selectivity. Win rate is essentially flat across entry extension buckets, from 0.78 to 0.835 regardless of how stretched the market was. The win rate comes from the exit: holding through adverse movement until price reverts, rather than stopping out.
That is a profound problem for anyone hoping to systematise the observation. The behaviour that produces the attractive statistic is precisely the behaviour that creates unbounded tail risk. Any hard stop lowers the win rate. A wide stop preserves most of it, but exposes the fat left tail that the record’s own worst-loss figure already shows.
Bracket structure testing made this concrete. Applying fixed take-profit and stop-loss brackets to the observed entry points, measured in units of average true range:
| Take-profit / stop-loss | Hit rate | Expected return per unit risk |
|---|---|---|
| 1.0 / 1.0 | 51.3% | +0.03 |
| 2.0 / 1.0 | 32.8% | −0.02 |
| 1.4 / 2.0 | 63.7% | +0.17 |
| 1.0 / 2.0 | 72.5% | +0.17 |
| 0.75 / 2.5 | 85.5% | +0.28 |
The apparent edge lives in a small take-profit with a wide stop. Larger take-profits weaken it; letting winners run makes it negative. Entry timing barely mattered: shifting entries by up to three bars moved the 1:1 hit rate only between 0.51 and 0.52. Entry structure mattered enormously.
This is a generic, publicly-known structural pattern: fade a statistical extension, take a small profit, use a wide stop. Nothing about it is proprietary to anyone. The remaining question was whether it survives the cost of actually trading it.
17. Why an observable edge failed under real bid/ask costs
Two research tracks tested whether that public market hypothesis was tradable. Both concluded it was not, in different ways, for different reasons, and the pair of failures is more instructive than either alone.
17.1 The vendor-data problem
The first track built a regime-gated mean-reversion strategy on the structure identified above, with a genuinely sealed holdout: the final evaluation period was hash-locked and opened exactly once.
On smoothed vendor price data, results were positive and survived stress testing:
| Test | Result |
|---|---|
| Training period | +3.54%, profit factor 1.18, 75% win rate, 3.1% drawdown |
| Sealed holdout (single run) | +1.67%, profit factor 1.26, 77% win rate, 2.1% drawdown |
| Holdout with +3 pip spread | still positive |
| Holdout with two-bar entry delay | still positive |
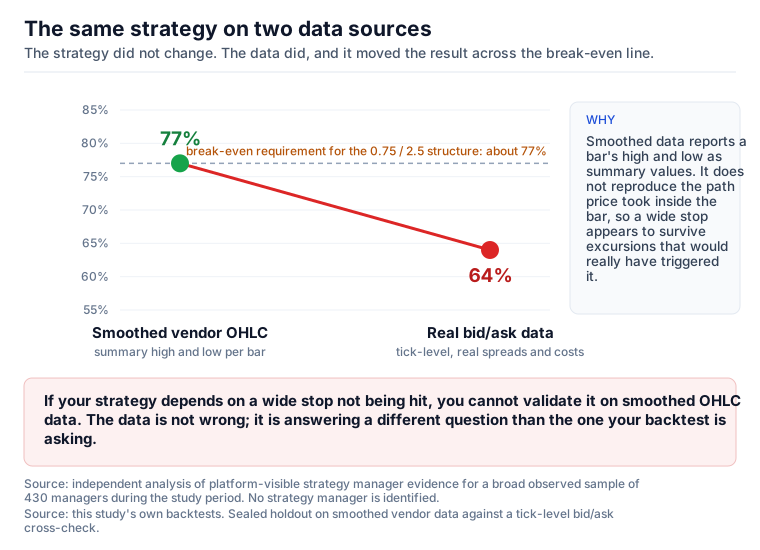
On real bid/ask data from a tick-level provider, the same strategy was negative at every stop width tested, with an observed win rate of 62% to 71% against a break-even requirement of about 77% for the 0.75/2.5 structure.
The explanation is mechanical, and it is the most transferable technical lesson in this paper. Smoothed vendor OHLC data reports a bar’s high and low as summary values. It does not reproduce the intrabar path. A wide stop placed 2.5 ATR away is only triggered by a genuine excursion, and smoothed data systematically under-represents those excursions. The strategy therefore appeared to survive adverse moves that, in reality, would have stopped it out. That inflated the win rate from a real figure near 64% to a fictitious 77%, which is precisely the difference between losing and winning for this structure.
If your strategy depends on a wide stop not being hit, you cannot validate it on smoothed OHLC data. The data is not wrong; it is answering a different question than the one your backtest is asking.
A later architectural refinement, allowing a bounded second position on a deeper extension, improved the sealed holdout materially (+4.72%, profit factor 1.45, Sharpe 1.65, against +1.67% and profit factor 1.26 for a single position). It did not close the vendor gap. Real-tick win rate stayed at 65.9%. Architecture improved the strategy; it did not change the verdict.
17.2 An independent search for a tradable edge
The second track ran a deliberately broader search, on a different instrument, with an execution model built to broker specifications: minute-level bid/ask data, historical spreads, explicit commission and slippage, real volume minimums and steps, mark-to-market drawdown, and a candidate set fingerprinted and committed before the final holdout was opened once.
It explored six strategy families (impulse exhaustion or fade, range breakout, liquidity sweep, volatility compression and expansion, session range, and a supervised model trained on the observed entry timestamps) across 1,584 screened candidates, 48 finalists, 24 state ensembles and 38 parameter neighbours.
| Family | Development | Combined walk-forward | Holdout |
|---|---|---|---|
| Impulse fade | +1.74% | −4.75% | −0.11% |
| Range breakout | −15.64% | −20.29% | +2.01% |
| Liquidity sweep | −20.27% | −23.28% | −2.59% |
| Compression and expansion | −0.36% | −4.98% | +1.18% |
| Session range | −33.32% | −32.65% | +2.37% |
| Supervised model on observed entries | −50.66% | −30.68% | −8.28% |
| State ensemble | −4.72% | −19.76% | −1.13% |
No candidate had all-positive folds. Every one lost under doubled costs. Zero of the 38 parameter neighbours was profitable. The two families showing holdout profit had already failed development and walk-forward before the holdout was opened, so those figures are not validation; they are noise in a period that happened to be favourable. One of them flipped from +2.37% to −2.05% and −4.89% when the bar boundaries were shifted by five and ten minutes.
The conclusion was to build no executable strategy at all from that research, on the correct principle that producing an implementation after a failed validation gate adds deployment risk without validated edge.
Why a negative result is worth publishing. It prevents false confidence. A reader who sees a smoothed-data backtest of a wide-stop strategy, with a 77% win rate and a clean equity curve, now has a documented reason to doubt it before committing capital. That is a more useful output than a strategy we could not honestly validate.
17.3 What the audit found in the first track’s own work
The independent audit’s review of the first track’s strategy work found real defects, and they are worth listing because they are common failure modes:
- Holdout contamination. The final 20% of data had been used in an earlier stress test; the strategy was then redesigned in light of that result, and the same interval was reused and described as never-seen. The headline result reproduced numerically but was not an unbiased holdout. The later, genuinely sealed holdout described in 17.1 was built specifically to fix this.
- Look-ahead in the entry-context study. Entry-context calculations used the closing value of an hourly bar that was still open at many entry timestamps, a subtle leak that inflates apparent entry quality.
- A reporting discrepancy. A stress result was stated as +9.4% in prose while the committed data showed +4.98%.
- A non-monotonic model artefact. A sizing defect made higher spread capable of increasing returns in one configuration. That is not robustness; it is a defect, and it is the kind of result that should immediately halt a backtest review.
- Parity gaps between backtest and live code: differing cooldown handling, holding-time semantics, volume handling, and position ownership. A strategy validated in a backtester that behaves differently from the deployed code has not been validated.
- Compilation never established. The strategy implementation had never been compiled against the real platform interface. When it finally was, it failed to compile, with two genuine errors against the actual interface. A strategy whose implementation has never been built is not a strategy that is ready for anything.
18. The forward-demo probe
One question survived all of this in a form that historical data cannot settle:
Do real broker fills behave like the optimistic smoothed model, or like the pessimistic bid/ask model?
That is not answerable from any vendor’s history. It requires observing actual fills at an actual broker. So the final deliverable is not a trading system. It is a measurement instrument.
What it is. An experimental automated strategy running on a demo account only, on a single instrument and timeframe, implementing the bounded two-position mean-reversion structure the research identified. It exists to record execution reality with enough fidelity to settle the question.
What it is explicitly not. It is not validated as profitable. It is not approved for live capital. It does not replicate any strategy manager’s method, and it was never intended to: it tests whether a generic, publicly-known structural pattern (fading statistical extension with a small target and a wide stop) survives retail execution costs.
What it measures. For every trade: the intended reference price against the actual fill, and the difference in pips; the spread at the moment of the decision; commission and swap actually charged; the exit reason as reported by the platform rather than inferred; maximum adverse and favourable excursion; and holding time. For every evaluated bar, including ones where no trade was taken: the full indicator state and the specific reason the signal was rejected. Rejected signals matter as much as taken ones, because without them you cannot distinguish "the edge failed" from "the risk controls never let it trade."
The decision rule was fixed in advance, which is the entire point of pre-registration:
- Realised win rate at or above about 0.74 and positive net profit after real commission and swap: the optimistic model was right; promote to provisional.
- Realised win rate near 0.65, or negative net: the pessimistic model was right; abandon the strategy family.
Engineering notes worth generalising. A deployment audit of the probe against the actual platform interface, rather than against its own comments, found fourteen material defects, two of them critical. Both are instructive:
- The persistence design would have produced no data at all in the platform’s default cloud execution environment, because it wrote to local files a cloud instance cannot access. The strategy would have started, reported healthy, traded, and silently recorded nothing. The runtime choice alone would have determined whether the experiment produced any evidence.
- A state-loss interaction changed trading behaviour, not just record-keeping. After a restart with missing state, adopted positions were stored with an entry-extension value of zero. The add-on gate compared each new signal against that zero baseline, found it "deeper," and permitted additional positions at any depth, silently converting a bounded two-position architecture into the unbounded averaging it was designed to exclude. Now, a position whose entry extension cannot be verified blocks add-ons entirely: lost state makes the system more conservative, never less.
The generalisable lesson: an automated strategy’s failure modes are not only in its signal logic. They are in what happens when it restarts, when its environment differs from your assumption, and when its record-keeping fails. Those paths deserve the same scrutiny as the entry rule.
19. Limitations and assumptions
Stated plainly, because a due diligence study that hides its own weaknesses is not one.
On the manager evidence:
- Visible data only. We studied what platforms display to prospective investors. Managers’ actual account sizes, leverage, internal risk rules and intentions are not observable.
- Trade volume is not published on one platform at all, for all 50,855 trades there. The size proxy used is proportional to size within one manager’s record on one instrument, and is not comparable across managers or instruments.
- The moving 200-trade limit bounds how far back any analysis can see on the windowed platform. Older behaviour is only partially recoverable, and trades that closed before observation began are permanently unavailable.
- The sample is what was observable, not a census. The 430 managers are those visible to the study during its observation period. Managers who failed and disappeared beforehand are absent entirely, so the observed sample is by construction more favourable than the full historical population: the classic survivorship problem. Managers who joined, paused, restricted their visibility or changed behaviour after observation are likewise unrepresented. No proportion in this paper should be read as a rate for either platform’s current directory.
- Balance drawdown excludes floating losses by construction on one platform, so it understates the risk of grid and averaging strategies. Our effective-drawdown floor mitigates but does not eliminate this.
- The risk gates are not forward-validated, for the structural reason that forward realised return cannot see losses deferred into open positions, which is the very blind spot the gates exist to cover.
- Correlation estimates are weak. They are computed on shared active days, in calm conditions, over short overlaps. Tail correlation during a liquidation event is not estimable from this data.
- Manager behaviour can change at any time without notice, and a strategy manager is not contractually bound to keep doing what their history shows.
On the strategy research:
- All backtest costs are modelled, not observed. Spread, slippage, commission and swap are assumptions until measured at a real broker, which is exactly why the demo probe exists.
- Single-instrument concentration and regime dependence both apply; the observed edge was stronger in recent periods, which may not persist.
- Demo is not live. Demo fills, spreads and rejection behaviour can differ from live. A demo result is necessary evidence, not sufficient evidence.
- Copy execution differs from direct execution. When you copy a manager, your fills, spreads, fees and timing are yours, not theirs. Copy slippage, minimum volume rounding and fee structures all degrade the copied return relative to the displayed one.
- Small accounts silently skip signals, which biases a forward test. Position size is
(equity * risk fraction) / (stop distance * pip value), and a broker enforces a minimum volume and step. When the computed size falls below that minimum, the trade simply does not happen. The wider the stop, the smaller the computed size, so the signals dropped are systematically the high-volatility ones. Our sizing analysis found that at a nominal $1,000 with 0.5% risk per trade, roughly 16% of this strategy’s signals would fall below a typical minimum and be skipped, against full coverage at around $3,000. Any forward test run on a small account is therefore measuring a calmer subset of its own strategy, and should say so. The running experiment records every such rejection so the effect can be quantified rather than assumed.
Above all: past results do not guarantee future returns. Every figure in this paper describes what already happened.
20. Frequently asked questions
What is copy trading due diligence?
It is the process of independently assessing a strategy manager’s observable evidence, including trade history, platform-disclosed statistics, behavioural patterns and risk characteristics, before allocating capital to copy them. It goes beyond the displayed return and win rate to test whether the record is complete, whether the risk figures measure what they appear to, and whether the manager’s behaviour contains hazards the headline statistics do not show.
Why is a high win rate a warning sign in copy trading?
Because it is trivially easy to manufacture by never closing losing trades. A manager who closes winners and holds losers open produces a near-perfect closed-trade record while accumulating unrealised losses that appear only in the equity drawdown figure. In our study, the single largest category of critical risk was exactly this pattern. Always read win rate alongside payoff ratio and equity-based drawdown.
What is the difference between profit factor and win rate?
Win rate is the proportion of trades that made money. Profit factor is gross profit divided by gross loss. A strategy can have a 90% win rate and a profit factor below 1 if its rare losses are large enough. Profit factor is the more informative of the two, but it can still be inflated when losing positions remain open and therefore sit outside the calculation.
Is a low maximum drawdown always good in copy trading?
No, and it should be challenged rather than admired. Check what the drawdown is computed on. If it uses realised account balance, unrealised losses on open positions are excluded by construction, so a strategy holding losing baskets can display a very low figure while carrying substantial real exposure. One record in this study reported a 0.25% drawdown while its floating losses equalled 100% of its realised profit. Mark-to-market equity drawdown is far more informative.
How do you detect a martingale or recovery-sizing strategy manager?
Compare the manager’s typical position size after a losing trade against their typical size after a winning trade. A ratio above about 1.4x warrants serious scepticism, and above 2x you should treat the displayed win rate as uninformative. Then check for clusters of same-direction entries at regular price intervals, look at the peak number of simultaneous open positions, and compare the worst single loss against the average win. In this study, managers sizing above 2x after losses had the highest median win rate in the whole sample, 87%, alongside a worst-loss tail roughly 2x larger and roughly 2x the peak simultaneous exposure of managers who did not escalate. None of the 89 managers sizing above 1.4x survived our screening gates.
Is grid trading risky when you copy it?
Grid and averaging strategies are legitimate approaches, and this study does not say otherwise. The risk when copying them is specific: their mechanics produce flattering closed-trade statistics (very high win rate, very low balance drawdown, very high profit factor) while the actual exposure accumulates in open positions the statistics do not cover. Grid mechanics were the primary behavioural classification for 109 of the 419 managers we scored. If you copy one, size it on its open exposure and worst-loss tail rather than on its win rate, and confirm whether the drawdown figure you are reading includes unrealised losses.
What are the biggest red flags in a copy trading strategy manager’s profile?
In the order they changed conclusions in this study: a very high win rate beside a non-trivial equity drawdown; position size after losses more than about 1.4x size after wins; losing trades held more than about 3x as long as winning trades; a worst single loss worth 20 or more average wins; double-digit simultaneous open positions; a record shorter than about 40 trades or 30 days; an extreme percentage return on a young or very small account; and a visible trade window that is materially more flattering than the platform’s own reported lifetime figures.
How many trades does a strategy manager need before their record is meaningful?
Our gates required a minimum of 40 closed trades and 30 days, but that is a floor, not a target. In practice we weighted multi-year records with thousands of trades far more heavily than short records with excellent ratios. A 61-trade, 69-day record with a profit factor of 7.5 is not stronger evidence than a 2,358-trade, three-year record with a profit factor of 2.
Can you tell what strategy a copy trading manager is running?
You can infer characteristics from observable behaviour: typical holding time, whether entries cluster after price extensions, how exposure overlaps, how size changes after losses. You cannot determine their actual method. In our study, two independent analyses agreed that one record’s entries tend to occur against statistically extreme recent price moves, and both agreed that this single fact was nowhere near sufficient to reproduce that manager’s selection, timing, sizing or exits.
Why did a strategy that backtested profitably fail on real bid/ask data?
Because smoothed vendor OHLC data reports summary highs and lows and does not reproduce the path price took within each bar. A strategy relying on a wide stop not being hit will appear to survive adverse moves that would really have stopped it out. In our test this inflated the win rate from roughly 64% to roughly 77%, the difference between a losing and a winning system for that structure.
How should I evaluate copy trading managers on platforms that only show recent trades?
Treat the window as a biased sample rather than a record, because the manager’s own closing decisions determine what appears in it. Compare the visible window’s win rate and worst loss against the platform’s lifetime figures: if the window looks materially better, it is window-biased. Require a longer observation span, require zero open exposure before you trust it, apply a confidence cap rather than treating it as equal evidence, and check whether the platform reports a lifetime trade count you can use to estimate coverage.
Should I diversify across multiple copy trading strategy managers?
Diversification only helps if the managers are genuinely independent, and that is harder to establish than it appears. Correlations computed on a small number of shared trading days are unreliable, and correlation in calm markets says little about behaviour during a liquidation event. Diversifying across different mechanisms and instruments is more defensible than diversifying across managers who merely have different names.
Is demo testing worthwhile before copying a strategy manager?
Yes, provided the acceptance criteria are written down before you start. Demo observation reveals copy slippage, actual fees, real spreads and any divergence between the manager’s displayed activity and what actually reaches your account. It cannot prove profitability, and demo conditions can differ from live, but it converts several assumptions into measurements.
What does it mean when a study says a strategy manager was "eliminated"?
In this study, eliminated means removed from the research shortlist under the study’s own disqualifying gates, on the evidence visible at the time. It is not a judgement that a manager is objectively bad, unsuitable for every investor, or doing anything improper. Many eliminated records belong to strategies working exactly as designed whose risk profile simply did not match what this study was screening for. The two largest elimination categories were about insufficient evidence rather than bad behaviour, and a different set of gates would produce a different shortlist.
How large does a demo account need to be to test an automated strategy fairly?
Large enough that the broker’s minimum volume never truncates a signal. Position size is account equity times the risk fraction, divided by the stop distance times pip value, so a wider stop produces a smaller size. When that size falls below the broker minimum, the trade simply does not happen, and the signals dropped are systematically the high-volatility ones. A forward test on an account that is too small is therefore measuring a calmer subset of its own strategy. Calculate the widest stop your account can size before you start, and compare it against your strategy’s typical stop distance.
About this research
This study was conducted independently, using only evidence that copy trading platforms make visible to prospective investors. It involved no privileged access, no confidential data, and no attempt to obtain any strategy manager’s proprietary methodology. All strategy managers are anonymised.
The analysis was deliberately run as two independent pipelines that did not see each other’s work until both had committed their results, and the disagreements between them are reported alongside the agreements. Where the two reached different conclusions, this paper explains the disagreement and how it was resolved rather than presenting a tidier consensus that did not exist.
Scope reminder. Every figure describes a broad observed sample of 430 managers during the study period, assessed under this study’s own definitions, at the time of observation. It is not a survey of every manager available on either platform, and it is not a current statement about any manager’s present behaviour.
Disclaimer. This article is for informational and educational purposes only. It is not investment advice, financial advice, or a recommendation to copy any strategy manager, use any platform, or enter any trade. Copy trading and leveraged trading carry a substantial risk of loss and are not suitable for all investors. Past performance is not indicative of future results. No strategy manager discussed here is identified, endorsed, or criticised as an individual, and "eliminated" throughout means excluded from this study’s research shortlist under this study’s gate definitions, not a judgement that any manager is objectively unsuitable for any investor. Any automated strategy described is experimental, runs on a demo account, and is not validated as profitable. You are solely responsible for your own investment decisions, and you should consider seeking advice from a licensed professional in your jurisdiction.
Trademarks and non-affiliation. cTrader, cTrader Copy, XM, and related names are trademarks or brands of their respective owners. This study is independent and is not affiliated with, endorsed by, or sponsored by any platform or broker mentioned.